
The market is complex.
Your perspective shouldn't be.
Fragmented news headlines and financial information, harmonized into actionable context. A unified view of the dynamic forces driving markets and investment performance.
Always-on intelligence for
interconnected financial markets
Three layers. One connected view.
From the world economy, through industries and markets, down to every company, with what connects them.
- 01
Economies & Geopolitics
The forces above every market
- Interest rates
- Inflation
- Jobs reports
- Fed decisions
- Tariffs & trade
- Export controls
- Conflicts & sanctions
- 02
Industries & Markets
How sectors move, and what moves them together
- Sector moves
- Oil & commodities
- Supply chains
- Global markets
- Regulatory changes
- Industry news
- 03
Companies
What moved each stock, and why
- SEC filings
- Earnings calls
- News & press releases
- Price moves
- Insider trades
- Fund ownership
- Options activity
- Analyst ratings
- Congressional trades
From raw data to market memory.
Filings, earnings calls, news, prices and economic releases are pulled in continuously, transformed into structured facts, and harmonized into one consistent, sourced record.
Data in
SEC filings, Earnings calls, Fed statements, Inflation & jobs data, Oil & commodities, Options positioning, 13F ownership, Insider trades, Analyst targets, Policy & regulation, Press releases, Global markets
Intelligence out
Understanding
Who supplies whom, Customers & competitors, Rate sensitivity, Commodity exposure, Policy exposure, Who owns what, Sector links
Interpretation
Why it moved, Impact on each holding, Bull & bear cases, Opposing views, Sector rotation, Rate & policy read-through, Signals
Memory
Ongoing storylines, Guidance over time, Estimates vs. actuals, Overdue expectations, Upcoming catalysts, Every fact, dated & sourced
Every market force, connected.
Strata connects the dots from events to the industries, companies and portfolios they reach.
Walmart is exposed to fuel costs
“We now expect more than $2 billion of incremental fuel-related costs this year, above and beyond our original guidance assumptions.”
The map behind your portfolio.
What moves your holdings often starts beyond the company itself. Strata connects developments across suppliers, customers, and macroeconomic exposures to help you understand what’s changing and why it matters to your portfolio.
Portfolio
NVDASemiconductors$227.58
- Customer AI spendingMicrosoft$34.6B
- Chip supply, unitsTSMC2.28M
- Data-center input costsCopper prices$4.59
- Data-center energy costsNatural gas prices$3.40
- Helped byAI demand
- Cost of capitalFed rate decisionsHold
- Trade policyChip tariffsUnder review
- Exposed toUS export controlsRestricted
Illustrative relationships, figures and policy scenarios. Not live market data.


Strata uses Plaid and SnapTrade to cover most brokerages and securely connect your financial accounts, so you can track your portfolio holdings and transactions.
World-class qualitative and quantitative financial data. Three ways to use it.
The same research on companies, industries, the economy and your portfolio, wherever you work.
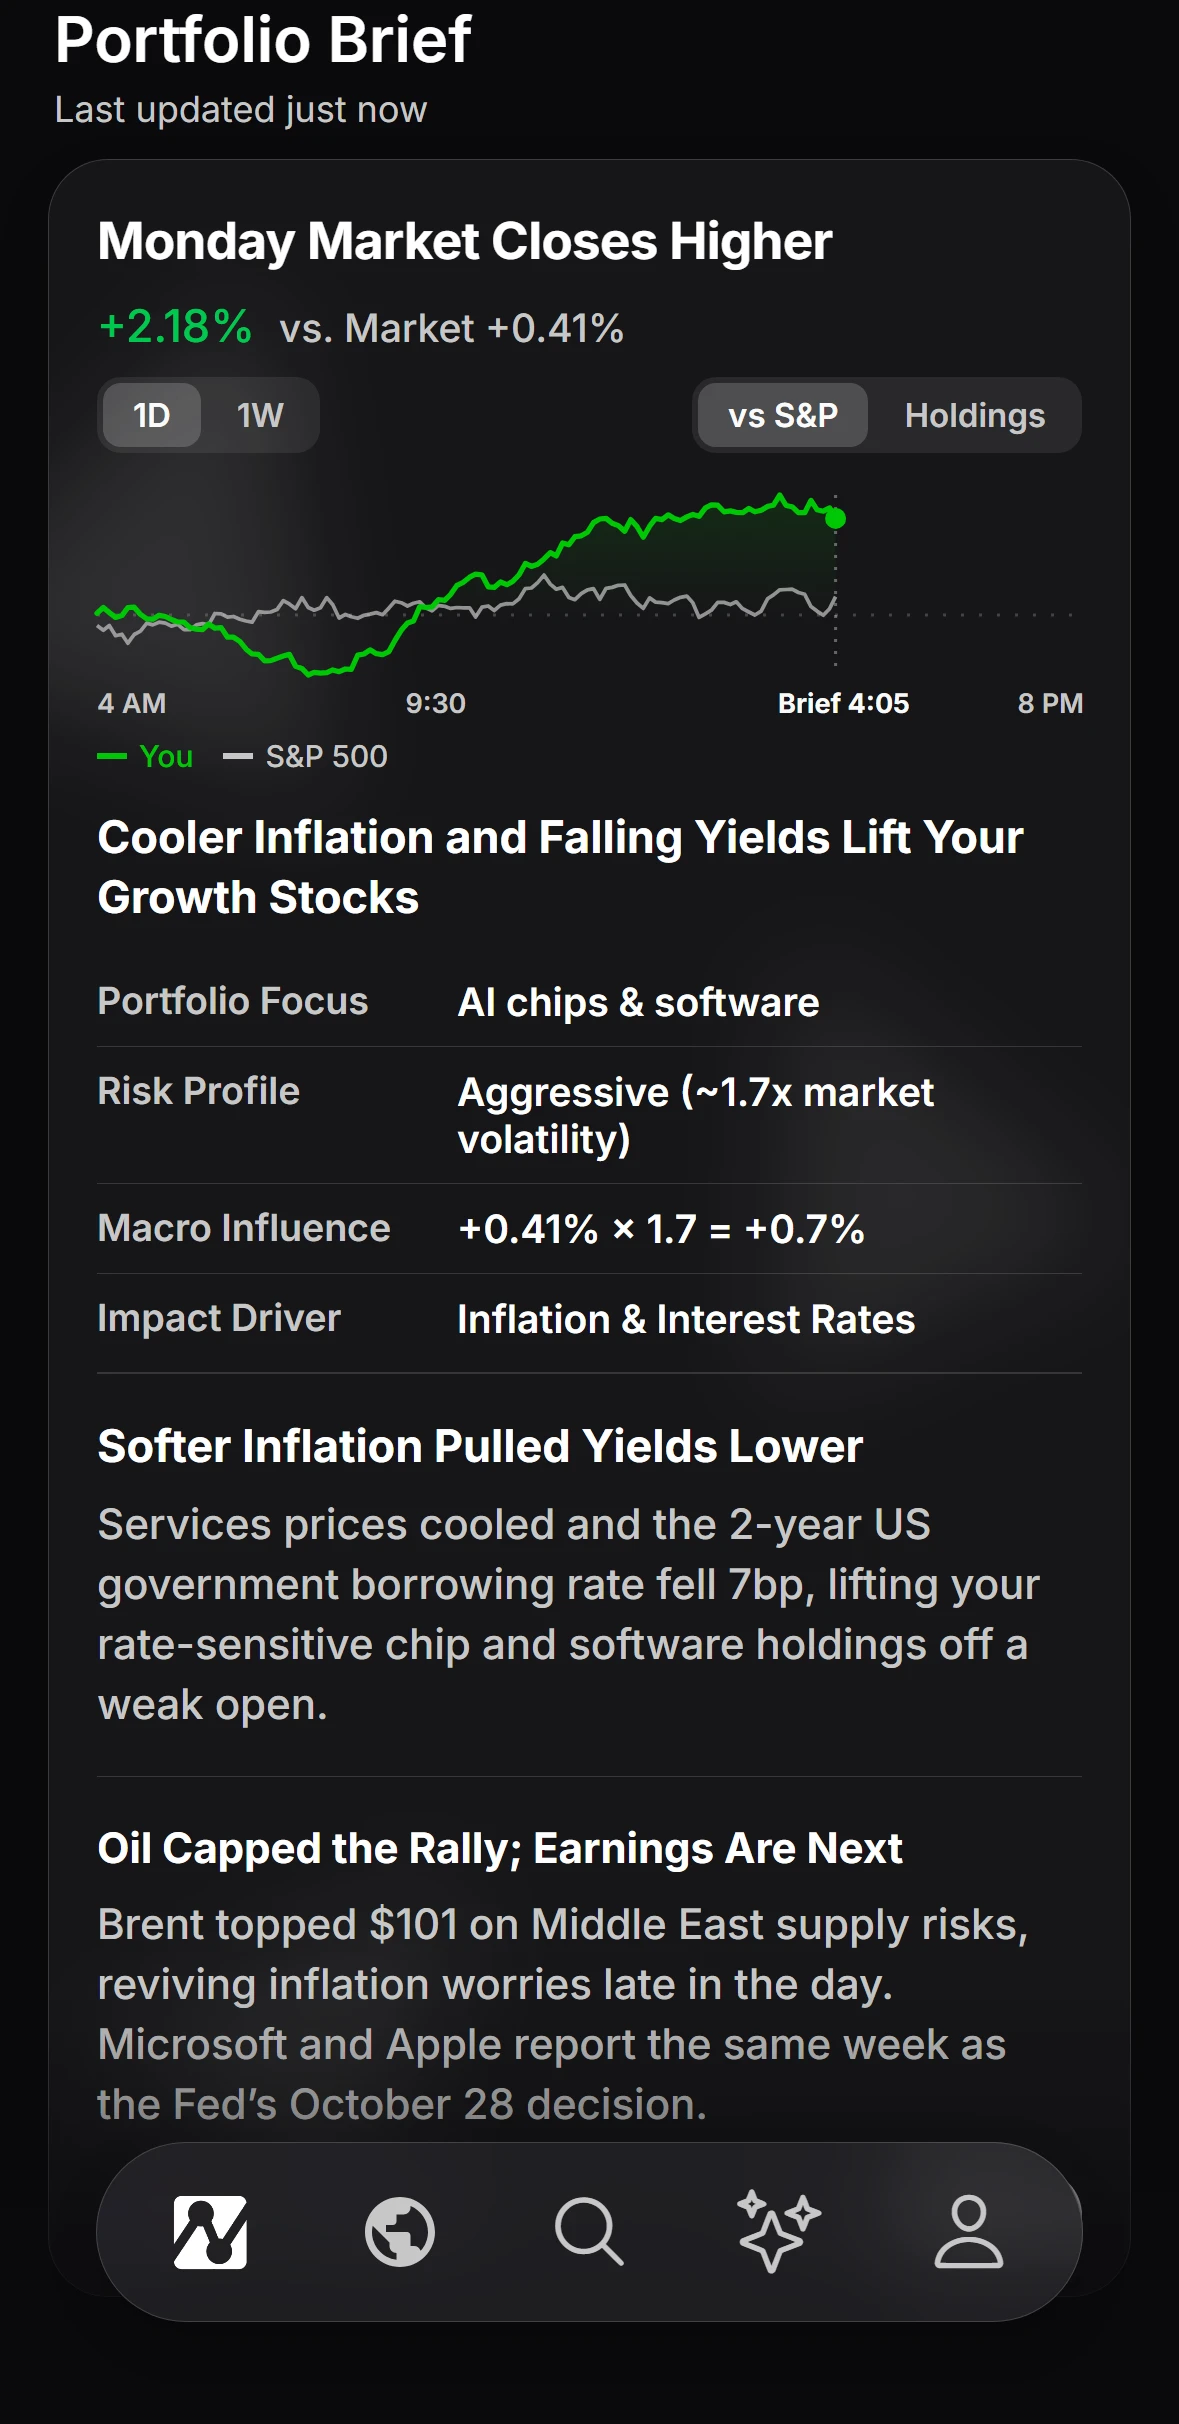
Strata Mobile App
Briefs on the world, your portfolio and every company you own, with the why behind each move.Learn moreData API
Company, industry, macro and market intelligence for your platform, research tools and AI agents.Learn moreMCP Server
Strata's research inside Claude, ChatGPT and any AI assistant that supports remote MCP servers.Learn more
Strata is a proud part of


We’re building at the frontier of AI, applying emerging technologies as they become available with support from world-leading providers. Our infrastructure combines advanced AI workflows, knowledge graphs, and scalable cloud computing to extract, transform, and harmonize market information into actionable context at scale.
Research that starts before you know what to ask.
Most AI tools wait for you to ask the right question. Strata is already asking them, and the answers are waiting when you open the app.
What changed in management's tone, guidance, or margin outlook?
Which tickers and sectors does this policy shift touch?
Is this a one-off, or does it change the demand picture?
How could this data point affect rates, demand, and margins?
What changed from the prior filing, and why could it matter?
What prior events does this resemble, and what happened next?
Is the price-target change driven by estimates, multiple, or sentiment?
Does this institutional move reinforce or conflict with the story?
Elite coverage.
From company disclosures and trading activity to economic releases and policy decisions, Strata brings together the information shaping the companies, industries, and markets you follow.
- SEC filings
- Earnings Calls
- News & press releases
- Prices & trading activity
- Insider trades
- Institutional ownership
- Options positioning
- Analysts
- Congressional trades
- Industry & commodities
- Policy & regulation
- Economic releases
Know what changed.
Institution or platform? Talk to us.